Editor’s note: This story is updated from the print edition.
Walking, running and jogging remain America’s most popular fitness activities, but despite their popularity, all have been in decline over the past three years, according to the Sports & Fitness Industry Association’s annual State of the Industry Report being issued this week.
The study, which offers a glimpse into the athletic participation habits of the U.S. population, provided mixed messages this year when it came to physical activity. For example, over the past three years of the report the number of “inactive Americans” increased from 80.4 million to 81.6 million. However, during the same time, the percentage of inactive Americans as part of the total surveyed decreased slightly, from 28 percent to 27.7 percent.
More than 72 percent of Americans age 6 and older were active in at least one sport or activity in 2015 — roughly 212.6 million, an increase of 3.3 million.
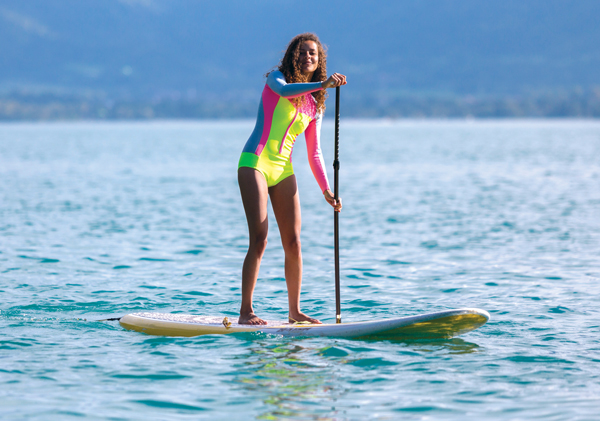 |
Participation in stand up paddle boarding is up nearly 117 percent over three years.
Photo by: GETTY IMAGES
|
In a rare positive sign for many of today’s properties, team sports rebounded, with 23.8 percent of Americans participating: the highest percentage since the study started in 2008.
SFIA defines team sports as: ultimate Frisbee, gymnastics, baseball, basketball, cheerleading, ice hockey, field hockey, football (flag, tackle, touch), lacrosse, paintball, rugby, soccer (indoor and outdoor), softball (fast-pitch, slow-pitch), track and field, volleyball (court, grass, sand/beach), wrestling, roller hockey and swimming on a team.
However, frequency or “core participation” in team sports has dropped from 53 percent to 48 percent over the nine years of the study. Long term, the industry must determine whether it’s still serving the one sport “avid enthusiast” or more of a generalist sports consumer.
“We’re seeing more people trying new kinds of activities, which is great,” said SFIA President and CEO Tom Cove, “but you cannot have a declining core base in team sports and not have it produce a long-term negative impact on our industry.”
Overall, America’s preferences for participatory sports are in flux. Walking, treadmill, and running/jogging have long been America’s top participatory sports, but those all declined over the past three years. Looking at the data more broadly, only four of the 10 most popular sports showed any increase in participation from 2014 to 2015 (see chart below).
Over the past three years of the study, only hiking showed any increase in participation of those ranked in the top 10 in the most recent report. Looking at the top 10 participatory sports over the past five studies, only three: running/jogging, hiking and stretching showed overall increases.
The nationwide online survey, taken in 2015 by 32,658 Americans, identified “fitness sports” as the most popular, with a 62 percent participation rate, followed by outdoor sports (48.4 percent); individual sports (34.3 percent); team sports (23.8 percent) and water sports (14.6 percent).
Hiking, yoga and swimming were among the biggest gainers in the latest study. According to the report, more than 25.2 million Americans participated in yoga at least once in 2015, more than those playing staples like golf (24.1 million), basketball (23.4 million) and tennis (17.9 million).
Meanwhile, the three fastest-growing participatory sports in America are stand-up paddle boarding (No. 1 for the third consecutive study), adventure racing, and competitive mixed martial arts. Those three activities have been the fastest growing for the past three years of the study. During that time, paddle boarding has seen a spike in participation of 116.9 percent; adventure racing participation increased 77 percent; while competitive MMA was up 72.3 percent. It’s also interesting to note rugby’s three-year growth rate of 52 percent.
While the data focuses on participation, the report does provide some insight on the state of the retail industry. With bankruptcies at established sporting goods retailers such as Sports Authority and Sports Chalet, the past year certainly can’t be considered normal for the industry.
The report indicates that the “athleisure” trend continues to boost the industry, especially since it is often sold across many different types of retailers, not just at sporting-goods outlets. A leading question is whether athleisure’s growth will take more share from performance footwear and apparel, which traditionally has higher price points and margins.
“Athleisure continues remarkably strong and overall, [athletic] footwear and apparel sales are healthy and we’re looking at an overall retail year of around 2 percent growth [of overall sporting goods retail], which is close to the economy as a whole,” Cove said. “Still, retail has been disrupted in every sector by e-commerce, and changed our sector in ways no one could have anticipated, especially on pricing.”
Licensed products were a mixed bag, with higher priced items, like replica and authentic jerseys, down in the mid-teens, while caps and T-shirts posted low single-digit sales gains.
As in so many businesses, the behavior of millennials is changing the business.
“Millennials are looking for ways to integrate fitness-related pursuits with social and everyday activities, which we see in the rise of athleisure” and in fitness classes, the report noted.
“Especially regarding women, this is arguably the first mature generation of elite athletes,” Cove said. “So their expectations for products, brands, and for their children is new and radically different — and something that is changing the entire industry.”
Based on three-year participation rate change
| Sport/fitness activity |
2015 (000s) |
2012 000s) |
3-yr % change |
| 1. Stand up paddling |
3,020 |
1,392 |
116.9 |
| 2. Adventure racing |
2,864 |
1,618 |
77.0 |
| 3. MMA for competition |
1,290 |
749 |
72.3 |
| 4. Triathlon (nontraditional/off-road) |
1,744 |
1,075 |
62.2 |
| 5. Rugby |
1,349 |
887 |
52.0 |
| 6. Bicycling (BMX) |
2,690 |
1,861 |
44.6 |
| 7. Boxing for competition |
1,355 |
959 |
41.4 |
| 8. Trail running |
8,139 |
5,806 |
40.2 |
| 9. Triathlon (traditional/road) |
2,498 |
1,789 |
39.7 |
| 10. Roller hockey |
1,907 |
1,367 |
39.5 |
| 11. Kayaking (whitewater) |
2,518 |
1,878 |
34.1 |
| 12. Squash |
1,710 |
1,290 |
32.6 |
| 13. MMA for fitness |
2,612 |
1,977 |
32.1 |
| 14. Lacrosse |
2,094 |
1,607 |
30.3 |
| 15. Boardsailing/windsurfing |
1,766 |
1,372 |
28.7 |
| 16. Backpacking overnight (more than 1/4 mile from vehicle/home) |
10,100 |
7,933 |
27.3 |
| 17. Field hockey |
1,565 |
1,237 |
26.5 |
| 18. Aerobics (high impact/intensity and training) |
20,464 |
16,178 |
26.5 |
| 19. Cardio tennis |
1,821 |
1,442 |
26.3 |
| 20. Kayaking (sea/touring) |
3,079 |
2,446 |
25.9 |
Source: SFIA
| Sport/fitness activity |
2015 (000s) |
1-yr % change |
3-yr % change |
5-yr % change |
| 1. Walking for fitness |
109,829 |
-2.4 |
-3.7 |
-2.0 |
| 2. Treadmill |
50,398 |
0.3 |
-0.9 |
-3.6 |
| 3. Running/jogging |
48,496 |
-5.1 |
-5.7 |
4.0 |
| 4. Bowling |
45,931 |
-1.5 |
-5.5 |
-18.8 |
| 5. Free weights (hand weights) |
42,799 |
2.7 |
NA |
NA |
| 6. Bicycling (road/paved surface) |
38,280 |
-3.6 |
-3.8 |
-3.6 |
| 7. Fishing (freshwater/other) |
37,682 |
-0.4 |
-3.4 |
-5.6 |
| 8. Hiking (day) |
37,232 |
2.8 |
7.9 |
14.4 |
| 9. Stretching |
35,776 |
0.4 |
-0.3 |
0.2 |
| 10. Stationary cycling (recumbent or upright) |
35,553 |
-0.4 |
-1.2 |
-1.3 |
| 11. Weight/resistance machines |
35,310 |
-1.5 |
-9.5 |
-9.9 |
| 12. Free weights (dumbbells) |
31,409 |
2.1 |
NA |
NA |
| 13. Elliptical motion trainer |
27,981 |
-0.2 |
-2.0 |
2.4 |
| 14. Camping (within 1/4 mile of vehicle/home) |
27,742 |
-3.2 |
-11.8 |
-15.1 |
| 15. Swimming for fitness |
26,319 |
4.0 |
13.4 |
NA |
| 16. Free weights (barbells) |
25,381 |
-0.9 |
-4.9 |
-6.7 |
| 17. Yoga |
25,289 |
0.1 |
8.8 |
20.4 |
| 18. Golf (on a golf course) |
24,120 |
-2.3 |
-4.6 |
-7.7 |
| 19. Basketball |
23,410 |
1.5 |
-1.3 |
-6.9 |
| 20. Calisthenics/bodyweight exercise and bodyweight accessory-assisted training |
22,146 |
-1.1 |
NA |
NA |
NA: Not available
Source: SFIA
