Can we accurately determine the quantity and quality of the media value the Dallas Cowboys deliver for an international brand? Can we do it in real time to inform and optimize creative decisions? Those are exactly the questions that Pepsi was looking to answer after securing signage rights for a new LED tunnel cover at the Dallas Cowboys’ AT&T Stadium. Pepsi was cognizant that the Cowboys commanded a large national and international broadcast audience in both television and digital channels. Therefore, an in-venue sign that was on camera would reach a huge number of people who could see the company’s branding.
Pepsi, however, was focused on more than how many people saw the logos of Pepsi, Lipton and Tostitos during games. To determine the quality of its television exposure, Pepsi needed to determine how long the logos appeared on screen (time), how closely the logos were to the focal points of the screen (centricity), how much of the screen the logos took up (prevalence), and how likely it was that its core consumers were watching the game (fit). These factors would determine the quality of the impressions with higher scores meaning higher value generated for Pepsi’s brands.
While broadcast viewable signage is a very important part of its deal with the Cowboys, Pepsi used to have to wait weeks or months to obtain these types of results. That is largely due to the manual nature of identifying logos during games. More specifically, people used to have to watch games with stopwatches and manually record where, when and how long logos appeared on screen. Then the results would have to be aggregated across different games in a season and delivered to a client usually in spreadsheet or PowerPoint form.
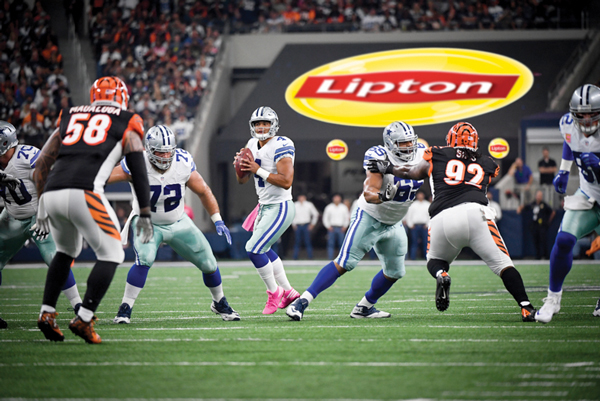 |
Computers learned how to think like humans to complete tasks related to logo impressions.
Photo by: DALLAS COWBOYS
|
Recent advances in machine learning, however, have made it possible to significantly reduce the time it takes to complete this process. Pepsi turned to Block Six Analytics to employ its media analysis platform to evaluate the performance of its tunnel cover in AT&T Stadium. B6A used a combination of deep convolutional neural networks and computer vision to automate the data collection and analysis process using MAP.
What does this mean in English? Essentially, B6A helped computers to learn how to see and think in similar ways that humans complete these tasks. Neural networks function like the mind. With the human mind, neurons (or brain cells) create connections that deepen as we have more practice learning a task. With our neural network, we taught our system to learn the Pepsi, Lipton and Tostitos logos by providing thousands of images of each brand. The neural network learns the important features of each logo, such as shape, size and color, to identify the logos in different contexts. The more images it sees, the better it becomes at classifying images by adjusting the weights of its “neurons” (or nodes) in its network. We then teach the computer to look for these images during broadcasts of Dallas Cowboys games and automatically determine the centricity, prevalence and time on screen each time the logos appear.
Quality, however, also included the fit for these Pepsi brands with the AT&T Stadium tunnel cover activation. B6A applied our corporate asset valuation model to determine how much value is created from a return on investment and return on objectives. For ROI, we determined the expected revenue generated from this partnership. For ROO, we determined how effectively Pepsi was able to achieve its brand and marketing goals from this partnership. We then layered these ROI and ROO metrics across three categories: Initiatives (what is a partner trying to accomplish), demographics (who is a partner trying to target) and channels (where is the best place to reach a partner’s customers).
Combining fit with time, centricity and prevalence provided Pepsi with the best way to determine the value it received from the Cowboys. What was equally important to Pepsi was that it no longer had to wait for weeks after a game was completed to obtain results. B6A’s MAP provided its initial valuation within 48 hours after the game was played. In addition, B6A created a Heat Map that visually shows the centricity, prevalence and time on screen for Pepsi. All of these results can live in B6A’s Partnership Scoreboard software as a service platform where Pepsi can see results for different games or aggregated results for the entire season.
Pepsi used B6A to determine that it already exceeded its value targets well before the season had concluded. As Pepsi Sports Marketing Director Justin Toman said, “Media value was a big piece of the value we were looking at in this deal … we have already received twice as much media exposure value as it cost to install the system.”
By having near real-time information from MAP at its disposal, Pepsi was quickly able to validate its decision to build the tunnel cover sign and optimize creative on a game-to-game basis. More importantly, Pepsi had the confidence to know it was making the best choice for its business and its brands more quickly than it had typically done in the past by using the results from B6A MAP to determine the value of in-venue signage outside of venue.
Adam Grossman is the CEO and founder of Block Six Analytics, whose clients include Pepsi, Gatorade, the Cleveland Browns and Philadelphia 76ers. He also is a lecturer for Northwestern University in its master’s of sports administration program, where he teaches classes focused on develop and communicate strategic insights through data.