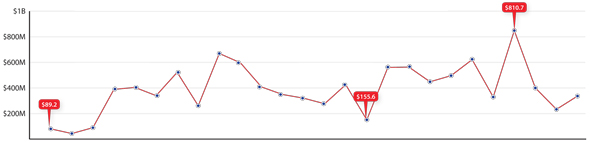
A record $810.7 million in college arena construction was completed last year. Nearly one-third of that total ($269 million) occurred as the result of the openings of seven new arenas. The year’s biggest project was the University of Illinois’ $169.5 million makeover of State Farm Center, formerly known as Assembly Hall.
 |
| |
1994 |
1995 |
1996 |
1997 |
1998 |
1999 |
2000 |
2001 |
2002 |
2003 |
2004 |
2005 |
2006 |
| College arenas |
$89.2 |
$55.0 |
$98.0 |
$379.0 |
$393.3 |
$333.1 |
$503.9 |
$259.2 |
$642.5 |
$574.4 |
$396.9 |
$341.5 |
$314.4 |
| |
2007 |
2008 |
2009 |
2010 |
2011 |
2012 |
2013 |
2014 |
2015 |
2016 |
2017 |
2018 |
2019+ |
| College arenas |
$273.5 |
$413.5 |
$155.6 |
$540.2 |
$542.6 |
$434.8 |
$479.8 |
$597.4 |
$322.9 |
$810.7 |
$389.3 |
$232.6 |
$330.0 |
This year, two-thirds of the $389.3 million that will be spent on college arena construction will come via new venues for DePaul and New Jersey Institute of Technology.
DePaul University
Costs: $164.0 million
Architect: Pelli Clarke Pelli Architects
General contractor: Prairie District3 Partners (coalition led by Clark Construction, consists of Bulley & Andrews, Old Veteran Construction, McKissack & McKissack, Goettsch Partners and Moody Nolan)
New Jersey Institute of Technology
Cost: $102.0 million
Architect: AECOM
General contractor: Torcon
| SEASON |
SCHOOLS |
AVERAGE |
| 2016-17* |
347 |
4,652 |
| 2015-16 |
346 |
4,744 |
| 2014-15 |
345 |
4,754 |
| 2013-14 |
345 |
4,817 |
| 2012-13 |
345 |
4,921 |
|
| SEASON |
SCHOOL |
AVERAGE |
| 2016-17* |
Kentucky |
23,462 |
| 2015-16 |
Kentucky |
23,361 |
| 2014-15 |
Syracuse |
23,854 |
| 2013-14 |
Syracuse |
26,253 |
| 2012-13 |
Kentucky |
23,099 |
|
| EAR |
CHAMPIONSHIP |
TOTAL |
AVERAGE |
CITY |
STADIUM |
| 2016 |
74,340 |
747,971 |
20,777 |
Houston |
NRG Stadium |
| 2015 |
71,149 |
739,798 |
20,550 |
Indianapolis |
Lucas Oil Stadium |
| 2014 |
79,238 |
739,189 |
20,533 |
Arlington, Texas |
Cowboys Stadium |
| 2013 |
74,326 |
800,377 |
22,233 |
Atlanta |
Georgia Dome |
| 2012 |
70,913 |
717,185 |
19,922 |
New Orleans |
Mercedes-Benz Superdome |
* Through March 5
Source: NCAA
| 2016-17 RANK |
SCHOOL |
2016-17* |
2015-16 (RANK) |
| 1 |
Kentucky |
23,462 |
23,361 (1) |
| 2 |
Syracuse |
22,682 |
21,592 (2) |
| 3 |
Louisville |
20,846 |
20,859 (3) |
| 4 |
North Carolina |
18,067 |
18,326 (4) |
| 5 |
Creighton |
17,413 |
15,941 (10) |
| 6 |
Wisconsin |
17,286 |
17,287 (6) |
| 7 |
Maryland |
16,628 |
17,863 (5) |
| 8 |
Kansas |
16,395 |
16,436 (9) |
| 9 |
Indiana |
16,364 |
17,106 (7) |
| 10 |
NC State |
15,907 |
16,758 (8) |
| 11 |
Nebraska |
15,427 |
15,429 (11) |
| 12 |
Arkansas |
15,247 |
14,879 (12) |
| 13 |
BYU |
14,901 |
14,699 (14) |
| 14 |
Michigan St. |
14,797 |
14,797 (13) |
| 15 |
Arizona |
14,410 |
14,526 (15) |
| 16 |
Iowa St. |
14,275 |
14,270 (16) |
| 17 |
Virginia |
14,245 |
14,111 (18) |
| 18 |
Purdue |
13,819 |
13,662 (20) |
| 19 |
Marquette |
13,716 |
13,308 (21) |
| 20 |
Tennessee |
13,637 |
14,232 (17) |
| 21 |
South Carolina |
13,396 |
11,995 (31) |
| 22 |
Dayton |
13,018 |
12,941 (25) |
| 23 |
Utah |
12,519 |
12,997 (24) |
| 24 |
Alabama |
12,442 |
13,110 (22) |
| 25 |
Iowa |
12,372 |
13,835 (19) |
* Through March 5
Source: NCAA
| YEAR |
NETWORK(S) |
RATING |
VIEWERS (000s) |
MATCHUP |
| 2016 |
TBS/TNT/truTV |
10.6 |
17,752 |
Villanova-North Carolina |
| 2015 |
CBS |
16.0 |
28,263 |
Duke-Wisconsin |
| 2014 |
CBS |
12.4 |
21,196 |
UConn-Kentucky |
| 2013 |
CBS |
14.0 |
23,426 |
Louisville-Michigan |
| 2012 |
CBS |
12.3 |
20,869 |
Kentucky-Kansas |
| 2011 |
CBS |
11.7 |
20,055 |
UConn-Butler |
| 2010 |
CBS |
14.2 |
23,944 |
Duke-Butler |
| 2009 |
CBS |
10.8 |
17,649 |
North Carolina-Michigan State |
| 2008 |
CBS |
12.1 |
19,501 |
Kansas-Memphis |
| 2007 |
CBS |
12.2 |
19,563 |
Florida-Ohio State |
Note: 2016 game featured team-centric simulcasts on TNT, truTV. Audience across all three networks is combined.
Source: Austin Karp, SportsBusiness Daily
| YEAR |
AVG. GAMES STREAMED PER VIEWER |
HOURS OF LIVE VIDEO CONSUMPTION |
| 2016 |
3.7 |
18.1 million |
| 2015 |
3.6 |
17.8 million |
| 2014 |
3.4 |
15.0 million |
| 2013 |
3.2 |
14.0 million |
| 2012 |
2.6 |
4.6 million |
Notes: Turner came onboard as full NCAA media partner in 2013. Hours in 2016 represent record for MML.
Source: Turner Sports