Are this year’s Pittsburgh Penguins about to join the ranks of the most-watched American sports teams?
Heading into their final regular-season games last week, the Penguins were on pace to post the highest average RSN rating for any U.S.-based MLB, NBA or NHL team since 2002. Penguins games on Root Sports were averaging a 12.56 Nielsen rating in the Pittsburgh market, a mark that would be the highest RSN rating for any U.S.-based NHL team on record.
 | |  |
Pittsburgh has drawn big ratings despite injuries to Sidney Crosby and other stars.
Photo by: GETTY IMAGES; Chart Source: SportsBusiness Journal analysis of Nielsen data
|
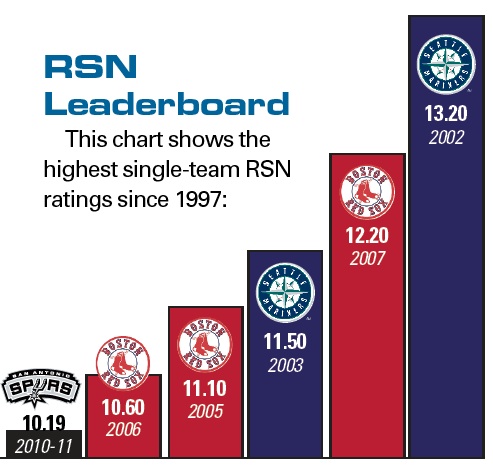
Since 1997, only the 2002 Seattle Mariners, who pulled a 13.2 average on FSN Northwest that year, would have a higher rating among U.S.-based MLB, NBA or NHL teams than what the Penguins were averaging as of last week, according to SportsBusiness Journal research.
 |
Pittsburgh Penguins
12.56
(as of April 21)
|
Before this year, the highest RSN rating in the last five years came in San Antonio for the 2010-11 season, when Spurs games on FS Southwest averaged a 10.19 rating. Before that, the Boston Red Sox averaged a 12.20 average on NESN for the 2007 season, the year in which they won their second World Series title of the decade.
For comparison’s sake, during Michael Jordan’s final season with the Chicago Bulls in 1997-98, the Bulls finished the year with an 8.9 average local rating on FSN Chicago.
How big is the Penguins’ 12.56 rating? The team has nearly doubled its TV audience since the 2008-09 season, moving from an average of 74,000 homes to an average of 146,000 homes.
During the last five weeks of the season, the rest of the league’s U.S.-based teams posted local ratings that were flat or declined. The Penguins, however, saw a 6 percent increase.
“The story has been wonderful since we trudged through the lockout and dropped the puck on the season,” said Shawn McClintock, senior vice president and general manager of Root Sports. “Sports fans in the city of Pittsburgh are incredibly passionate, loyal and knowledgeable.”
The Penguins’ TV ratings were helped by the team having compelling story lines throughout the NHL’s lockout-shortened season. Despite stars Sidney Crosby, Evgeni Malkin, James Neal and Kris Letang all missing substantial time with injuries, the Penguins finished second overall in the league, behind only the record-setting Chicago Blackhawks, and first in the Eastern Conference. Before he suffered a broken jaw on March 30, Crosby was the NHL’s leading scorer with 56 points (15 goals, 41 assists) in 36 games.
While traditionally strong, the Penguins’ TV numbers reached historic levels this season. Sixteen of the 20 highest-rated Penguins games of all time occurred this season, McClintock said. The other four were historically memorable games: Mario Lemieux’s return in 2000; the closing of Mellon Arena in 2010; and Crosby’s two returns from injury last year.
It wasn’t just Pittsburgh that saw a burst of viewership interest in the NHL this year. Thanks largely to this season’s lockout-shortened schedule, local TV ratings throughout the league saw significant increases. Ratings for 17 of the 21 teams obtained by SportsBusiness Journal registered increases, with 16 of them showing double- or triple-digit jumps.
Data for Carolina and Nashville and for the league’s seven Canadian teams was not available.
The NHL increase mirrors the NBA’s experience during that league’s shortened 2011-12 season, when the NBA’s similarly compressed schedule led to higher TV ratings across the board. Because of the lockout, the NHL started this season in January instead of October, and teams played 48-game schedules rather than 82.
Another good story for the league occurred in Chicago, where Blackhawks games on Comcast SportsNet Chicago averaged a league-high 192,000 homes. The team has posted a viewership increase five straight seasons, growing consistently from an average audience of 21,600 homes per game in 2007-08, when Rocky Wirtz took over the team and immediately worked a deal to show the team’s home games on local TV.
Wirtz’s father, Bill, as owner of the team, had long objected to having such local TV coverage of Blackhawks home games because he believed it would negatively affect ticket sales.
The Colorado Avalanche is at the other end of the spectrum. With the Western Conference’s worst record on the ice, the Avs saw their games on Altitude average only 13,000 homes. In the 2009-10 season, Avs games were at nearly double that number (24,000).
This season, only the Columbus Blue Jackets (10,000 homes) and Florida Panthers (4,000 homes) had lower local audience averages.
Staff writer Christopher Botta contributed to this report.
NHL teams’ RSN results: 2012-13 season
| AVERAGE RATING |
| Top 5 |
| Pittsburgh | Root Sports | 12.56 (+56.4%) |
| Buffalo | MSG | 9.46 (+44.4%) |
| Boston | NESN | 6.60 (+41.0%) |
| Chicago | CSN Chicago | 5.50 (+76.8%) |
| Minnesota | FS North | 4.27 (+95.0%) |
| Bottom 5 |
| Los Angeles | FS West | 0.59 (+55.3%) |
| New Jersey | MSG Plus | 0.50 (+51.5%) |
| New York Islanders | MSG Plus | 0.49 (+133.3%) |
| Anaheim | Prime Ticket | 0.40 (+37.9%) |
| Florida | FS Florida | 0.22 (0.0%) |
| |
| AVG. AUDIENCE SIZE |
| Top 5 |
| Chicago | CSN Chicago | 192,000 (+76.1%) |
| Boston | NESN | 156,000 (+40.5%) |
| Pittsburgh | Root Sports | 146,000 (+55.3%) |
| New York Rangers | MSG | 126,000 (+72.6%) |
| Philadelphia | CSN | 90,000 (-9.1%) |
| Bottom 5 |
| Dallas | FS Southwest | 18,000 (+12.5%) |
| Phoenix | FS Arizona | 16,000 (+128.6%) |
| Colorado | Altitude | 13,000 (-23.5%) |
| Columbus | FS Ohio | 10,000 (+11.1%) |
| Florida | FS Florida | 4,000 (+33.3%) |
| |
| RATING CHANGE |
| Top 5 |
| New York Islanders | MSG Plus | +133.3% (0.49) |
| Phoenix | FS Arizona | +117.5% (0.87) |
| Minnesota | FS North | +95.0% (4.27) |
| Chicago | CSN Chicago | +76.8% (5.50) |
| New York Rangers | MSG | +71.7% (1.70) |
| Bottom 5 |
| Washington | CSN Mid-Atlantic | +2.0% (1.53) |
| Florida | FS Florida | 0.0% (0.22) |
| San Jose | CSN California | -5.8% (1.30) |
| Philadelphia | CSN | -7.8% (3.06) |
| Colorado | Altitude | -24.1% (0.85) |
| |
| AUDIENCE SIZE CHANGE |
| Top 5 |
| Chicago | CSN Chicago | +83,000 (192,000) |
| New York Rangers | MSG | +53,000 (126,000) |
| Pittsburgh | Root Sports | +52,000 (146,000) |
| Boston | NESN | +45,000 (156,000) |
| Minnesota | FS North | +36,000 (74,000) |
| Bottom 6 |
| Columbus | FS Ohio | +1,000 (10,000) |
| Washington | CSN Mid-Atlantic | +1,000 (36,000) |
| Florida | FS Florida | +1,000 (4,000) |
| San Jose | CSN California | -2,000 (33,000) |
| Colorado | Altitude | -4,000 (13,000) |
| Philadelphia | CSN | -9,000 (90,000) |
Notes: Comparable data for Carolina, Nashville and for the league’s seven Canadian teams was not available. Information is for games played through April 21, 2013, compared to full-season 2011-12 numbers. NHL teams this year played 48-game schedules that started in January, after the lockout. The 2011-12 season featured the league’s traditional 82-game schedule, starting in October.
Source: Nielsen
