The pie just keeps getting bigger.
Media rights revenue generated by the North American sports industry is projected to total $18.2 billion this year, the category’s third consecutive year of double-digit annual growth, according to a report scheduled to be released today by PricewaterhouseCoopers.
The annual PwC Sports Outlook forecasts growth across the industry in each of the categories it tracks — tickets, merchandise, media rights and sponsorships — but acknowledges that the media segment’s “torrid pace of growth realized over the past decade” is likely to slow and that the next rights deal cycle is unlikely to enjoy similar increases. The primary rights deals for the biggest media contracts — the NFL, NBA, MLB, NHL, NASCAR, MLS, College Football Playoff and NCAA men’s basketball tournament — are all secured for the next several years.
“What a lot of the industry is getting ready for is, ‘What will come through in the next cycle of media rights and what will the digital world look like?’” said Adam Jones, director of sports advisory services for PwC. “On both sides of the table, everyone needs to be smart on what the next phase will look like.”
For example, the report says that technologies such as virtual reality and live-streaming over social media sites will gradually supplement the league’s deals from 2017 onward.
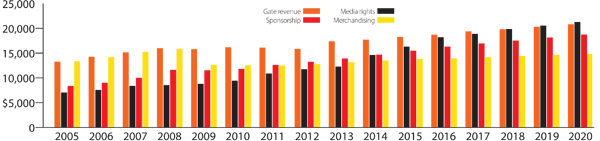
PwC projects that total revenue from the four measured areas, accounting for both professional and college sports in North America, will grow from $63.9 billion last year to $67.2 billion this year, or a 5.2 percent increase, and to $75.7 billion in 2020, an 18.5 percent jump over that time period.
PwC projects that total revenue from the four measured areas, accounting for both professional and college sports in North America, will grow from $63.9 billion last year to $67.2 billion this year, or a 5.2 percent increase, and to $75.7 billion in 2020, an 18.5 percent jump over that time period.
This year alone, the media category is projected to jump 12 percent over 2015, following a similar year-over-year increase last year and 19 percent in 2014.
Looking at the top two segments, media rights ($21.3 billion) and gate revenue ($20.8 billion) are each projected to account for 28 percent of the total revenue in 2020, according to the study. In contrast, media made up just 17 percent ($7 billion) of the sports industry pie in 2005, while the gate accounted for nearly one-third.
For now, however, ticket sales ($18.7 billion in 2016) generate the most revenue for the industry, as it has since at least 2005, the first year that PwC analyzed these specific segments.
The report does not include the annual cost to lease premium seats or fees for personal seat licenses; its gate-revenue calculations are based on the face value of tickets. PwC did estimate the size of the premium-seat market in the major leagues at $7.3 billion, the first time it has calculated that segment, but for consistency sake it didn’t include the premium-seat figure in the overall total.
It also doesn’t measure in-venue spending. However, it does address the evolving changes in the in-game experience and how it directly correlates to gate revenue. The trend of transforming seldom-sold seating areas and undeveloped spaces in sporting venues into large gathering and/or premium-ticket areas has helped sustain the industry’s overall gate revenue. The Colorado Rockies, for example, have seen huge success with their Rooftop seats that were introduced in 2014. For most games, the general admission ticket costs $14 and includes a $6 concession or merchandise credit that can be used throughout Coors Field.
“I think people come for the game but it is secondary to wanting to experience the social scene,” acknowledged Kevin Kahn, the Rockies’ longtime vice president and chief customer officer of ballpark operations.
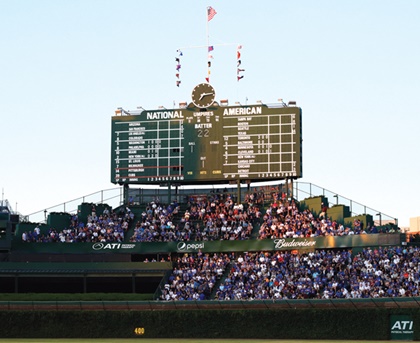 |
Despite high-value locations like the new Pepsi Batter’s Eye at Wrigley Field, signage’s share of sponsorship revenue is projected to fall.
Photo by: GETTY IMAGES
|
Such areas help drive up gate revenue and are being built throughout pro and college sports. Overall, there is more than $15 billion committed to 87 stadium, racetrack and arena construction projects in the U.S. and Canada, according to SportsBusiness Journal research, and the opening of new and renovated facilities historically helps ticket sales.
The sponsorship category is another segment experiencing a reallocation of dollars.
While in-venue signage such as Wrigley Field’s new Pepsi Batter’s Eye, located in the Budweiser Bleachers below the iconic scoreboard, will receive premium exposure during the playoffs, the report projects that revenue from signage will make up one-third of the category’s total in 2020, down significantly from 46 percent this year. The shift in dollars, though, will be “taking place under the radar,” Jones said, with expected increases in digital activation and brand sponsorship of team- or league-related community outreach.
Jones said that PwC data shows that brands and properties are increasingly finding ways to team up and engage consumers outside the sports venue.
While the report indicates that sponsorship was surpassed in size by media rights in 2015, the study still projects 21 percent growth for the sponsorship sector between 2015 and 2020.
Licensed merchandise sales make up the fourth-biggest contributor to the industry’s overall economy, according to the study. Such sales are projected to increase 7 percent by 2020, from an estimated $13.8 billion last year to $14.8 billion. Despite seeing growth each year since 2012 and projected annual increases through 2020, the category will still be more than $1 billion below its 2008 peak of $15.9 billion.
The study spotlights soccer as a big contributor to licensed merchandise’s growth. For example, continued expansion in MLS, the introduction of European club merchandise into the North American market, and shifting demographics are all tied to soccer’s continued growth in licensed merchandise sales. PwC says the sport continues to report the highest year-over-year revenue growth of the major professional sports.
PwC has published its Global Entertainment and Media Outlook report for 17 years. It published a global outlook focusing on the sports industry starting in 2011, and in 2013 it debuted its report looking specifically at the North American sports marketplace.
PwC projects that the North American sports market will grow to $75.7 billion in 2020, and in 2018 the media rights segment will become the industry's most lucrative revenue stream.
| |
2005 |
2006 |
2007 |
2008 |
2009 |
2010 |
2011 |
2012 |
| Gate revenue* |
$13,284 |
$14,261 |
$15,139 |
$15,984 |
$15,778 |
$16,176 |
$16,116 |
$15,821 |
| Media rights |
$7,041 |
$7,546 |
$8,388 |
$8,540 |
$8,809 |
$9,423 |
$10,858 |
$11,743 |
| Sponsorship |
$8,380 |
$9,003 |
$10,016 |
$11,616 |
$11,514 |
$11,820 |
$12,615 |
$13,257 |
| Merchandising** |
$13,358 |
$14,191 |
$15,255 |
$15,860 |
$12,631 |
$12,571 |
$12,482 |
$12,771 |
| Total |
$42,063 |
$45,001 |
$48,798 |
$52,000 |
$48,732 |
$49,990 |
$52,071 |
$53,592 |
| |
2013 |
2014 |
2015 |
2016 |
2017 |
2018 |
2019 |
2020 |
| Gate revenue* |
$17,372 |
$17,707 |
$18,265 |
$18,721 |
$19,372 |
$19,789 |
$20,318 |
$20,818 |
| Media rights |
$12,262 |
$14,595 |
$16,305 |
$18,218 |
$18,876 |
$19,868 |
$20,533 |
$21,289 |
| Sponsorship |
$13,900 |
$14,689 |
$15,481 |
$16,301 |
$16,931 |
$17,541 |
$18,128 |
$18,741 |
| Merchandising** |
$13,144 |
$13,493 |
$13,806 |
$13,966 |
$14,200 |
$14,422 |
$14,624 |
$14,822 |
| Total |
$56,678 |
$60,484 |
$63,857 |
$67,206 |
$69,379 |
$71,620 |
$73,603 |
$75,670 |
* Does not include the cost to lease premium seats or fees for PSLs; includes only the face value of the ticket. ** Food and beverage concession sales are not included. Note: Numbers have been rounded. Figures for years 2016 and beyond are projected amounts. Source: PricewaterhouseCoopers