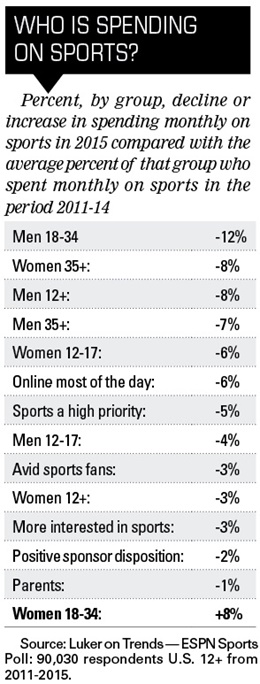
How often people spend money on sports is one indicator of how engaged and invested they are in sports in general. In 2015, 23.4 percent of Americans spent on sports at least once a month, a 6 percent decline from the average 24.9 percent for 2011-14. This trend, if it continues for five more years, will reduce the number of people spending monthly by 10 million. But the potential size of the impact is not the point. More important is the context of the year in which it happened.
 |
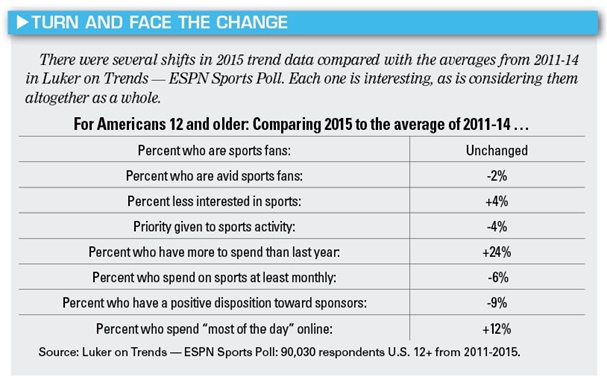
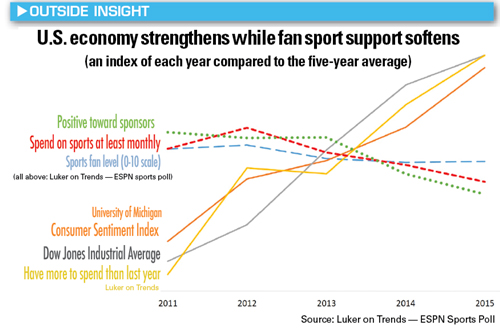
In 2015, the percentage of Americans saying they had more money to spend after paying all their bills increased by 24 percent compared with the average from 2011-14, according to the Luker on Trends — ESPN Sports Poll data, which gathered 60 consecutive monthly samples from more than 90,000 Americans 12 and older to track issues that affect sports. The University of Michigan Consumer Sentiment Index, which measures consumer confidence, rose by 21 percent in 2015 compared with 2011-14, and the Dow Jones Industrial Average was up 24 percent in 2015 compared with 2011-14. These three sources of data, showing similar growth, indicate a context where more frequent spending in sports should have taken place. And generally, for more than 22 years, engagement in sports has mirrored the performance of the economy and personal finances. We noticed a shift in those trends around 2011, when it seemed the economy was perking up.
 |
The percentage of American sports fans remained near a very stable 88 percent from 2011-15, but avid fans declined by 2 percent in 2015, and those who placed a high priority on time and investment in sports interests dropped 4 percent. Similarly, 4 percent more Americans said they were “less interested in sports than they were the year before” in 2015, compared with the 2011-14 average.
RICHARD CURTIN
RESEARCH PROFESSOR, DIRECTOR OF SURVEYS OF CONSUMERS, UNIVERSITY OF MICHIGAN
■ Is there anything in the trend in consumer sentiment over the last five years that might shed light on why sports fans, having stable interest and more discretionary dollars, are spending less often on sports?
“Consumer perspectives on the economy have changed significantly during the past five years. It was widely anticipated that the economy would recover at a reasonably quick pace five years ago, but consumers have since concluded that only slow and uneven economic gains could be anticipated. While recent economic gains have been widely recognized by consumers, nearly every household has had to re-evaluate their spending priorities. Moreover, in an era of ultra-low inflation, spending choices have become more dependent on price comparisons. Importantly, admissions to sporting events rose seven times faster than the overall inflation rate during 2015. To be sure, what hasn’t changed is that expenditures on sports remain an important source of enjoyment for consumers.”
Let me compare this to ice cream. Nearly everyone likes ice cream. That doesn’t mean they will always eat it. Changes can happen that consciously or unconsciously cause them to eat less. So it is with sports. The chart shows the two trend paths. Consumer sentiment, the stock market and fan discretionary dollars were all on the rise. At the same time, the overall level of interest in sports, percent spending at least monthly on sports, and those who have a positive disposition toward sponsors (down 9 percent) were softening. Sports fans had the dollars and the disposition to spend.
The U.S. Department of Labor’s Bureau of Labor Statistics reported 9 percent growth in overall spending on entertainment in 2014 (the most recent year of data available), compared with the four previous years. Another powerful indicator of leisure spending is food away from home, which was up 8 percent in 2014. Did you know more money is spent on food away from home in America than all other forms of entertainment combined? The Sports and Fitness Industry Association reports that, across a spectrum of sports, manufacturers’ sales of products to retailers have been up every year since at least 2009. So consumers did spend in 2015, but we cannot count on that continuing going forward.
The value of trend research has much more to do with how you prepare for the future than just what you see today. The problem is not today (see Forward Thinking).
There is likely something bigger in the combination of declines in priority, spending and sponsorship support, and the increasing number of people saying they are less interested in sports now compared with the previous year.
The bigger factor affecting declines is also likely the most obvious: time spent online.
Time is not a concept in online behavior. Nobody says, “I can’t meet you today, I am online from 2:30-4 p.m.” No, we have a need or desire we know can be met online and we go online. We were going to do one thing, and before we knew it, an hour had gone by. In 2011, 16 percent of all Americans 12 and older said they are online “most of the day.” They admitted it. By the end of 2015 the percentage grew to just under 22 percent. One in five Americans admits they are online most of the day. Many more are as well and just don’t realize it. The declines we are seeing are in no small part being driven by competition that is unconscious, unintentional, not time bound and not dedicated. With the trends we are seeing, more of a fan’s time is going online. Over time, streaming video and social sites are growing in importance to Americans while sports applications remain strong but are not growing in importance at the same rate.
Because most Americans continue to “like” sports, we easily assume they will always be there and be invested. We all like ice cream, too, but when was the last time you scheduled time to get some? Sports provide so many ways to be bonded to fans. Lingering uncertainty about the economy coupled with the ease of increased and fulfilling online activity requires us to do more to solidify the bond with our fans. Team logos are to be found in tattoos and on tombstones. Are we doing as much to ensure that kind of relationship into the future as our best fans are already doing in their dedication to us?
The fact is, these declines are beginning to be realized within the fan bases of individual sports. Here again, we haven’t seen declines in behavior just yet, but if the trends in perspectives continue, we no doubt will.
Rich Luker (rich@lukerco.com) is the founder of Luker on Trends and the ESPN Sports Poll.